Canvas
An infinite board that holds an analysis as connected objects: SQL queries that run, charts bound to their results, and the notes that frame them. Assemble it through an AI agent that works from your schema, or build each object by hand.
Why use it
A query tab answers one question and scrolls away. A canvas keeps the whole analysis in view: the SQL that pulls the data, the chart that makes it readable, and the notes that explain it, arranged side by side on an infinite board you pan and zoom. Reach for a canvas to:
- Go from a question to a chart fast. Type "monthly sales by category" and the agent writes the query, builds the chart, and runs both.
- Assemble a dashboard-style view. Several queries, charts, and tables laid out together and refreshed on demand.
- Explore step by step. Chain one query off another's results, branch into variants, and annotate as you go.
- Work across databases. Put a query on each connection and have the agent reference them together.
Open a canvas
There are two ways to start a board:
- Click New Canvas, the sparkles button , in the editor tab bar.
- Right-click an empty area of the Canvas section in the left sidebar and choose New Canvas.
A canvas opens as an ordinary editor tab (not a separate window), auto-titled Canvas 1,
Canvas 2, and so on. The tab splits into a resizable agent chat pane on
the left and the board on the right. Rename a board by double-clicking its row in the sidebar
Canvas list, or right-click the row and choose Rename.
Connections
A new board adopts whatever connection the editor currently has selected. To change or add to that, use the Connection picker at the top of the agent pane. It is a multi-select: add several databases and the agent reads every one's schema, so a single board can mix sources. Picking a database that is not connected yet connects and loads it automatically.
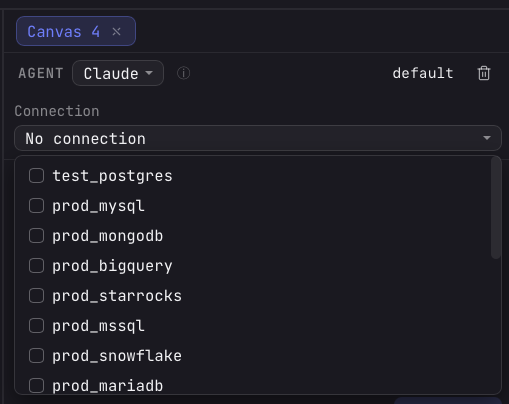
The first connection in the set is the board's primary: it is the default for query cells you add by hand. Every query cell also stores its own connection, which you can change in the properties pane, so different cells on one board can run against different databases. The connection set is saved with the board.
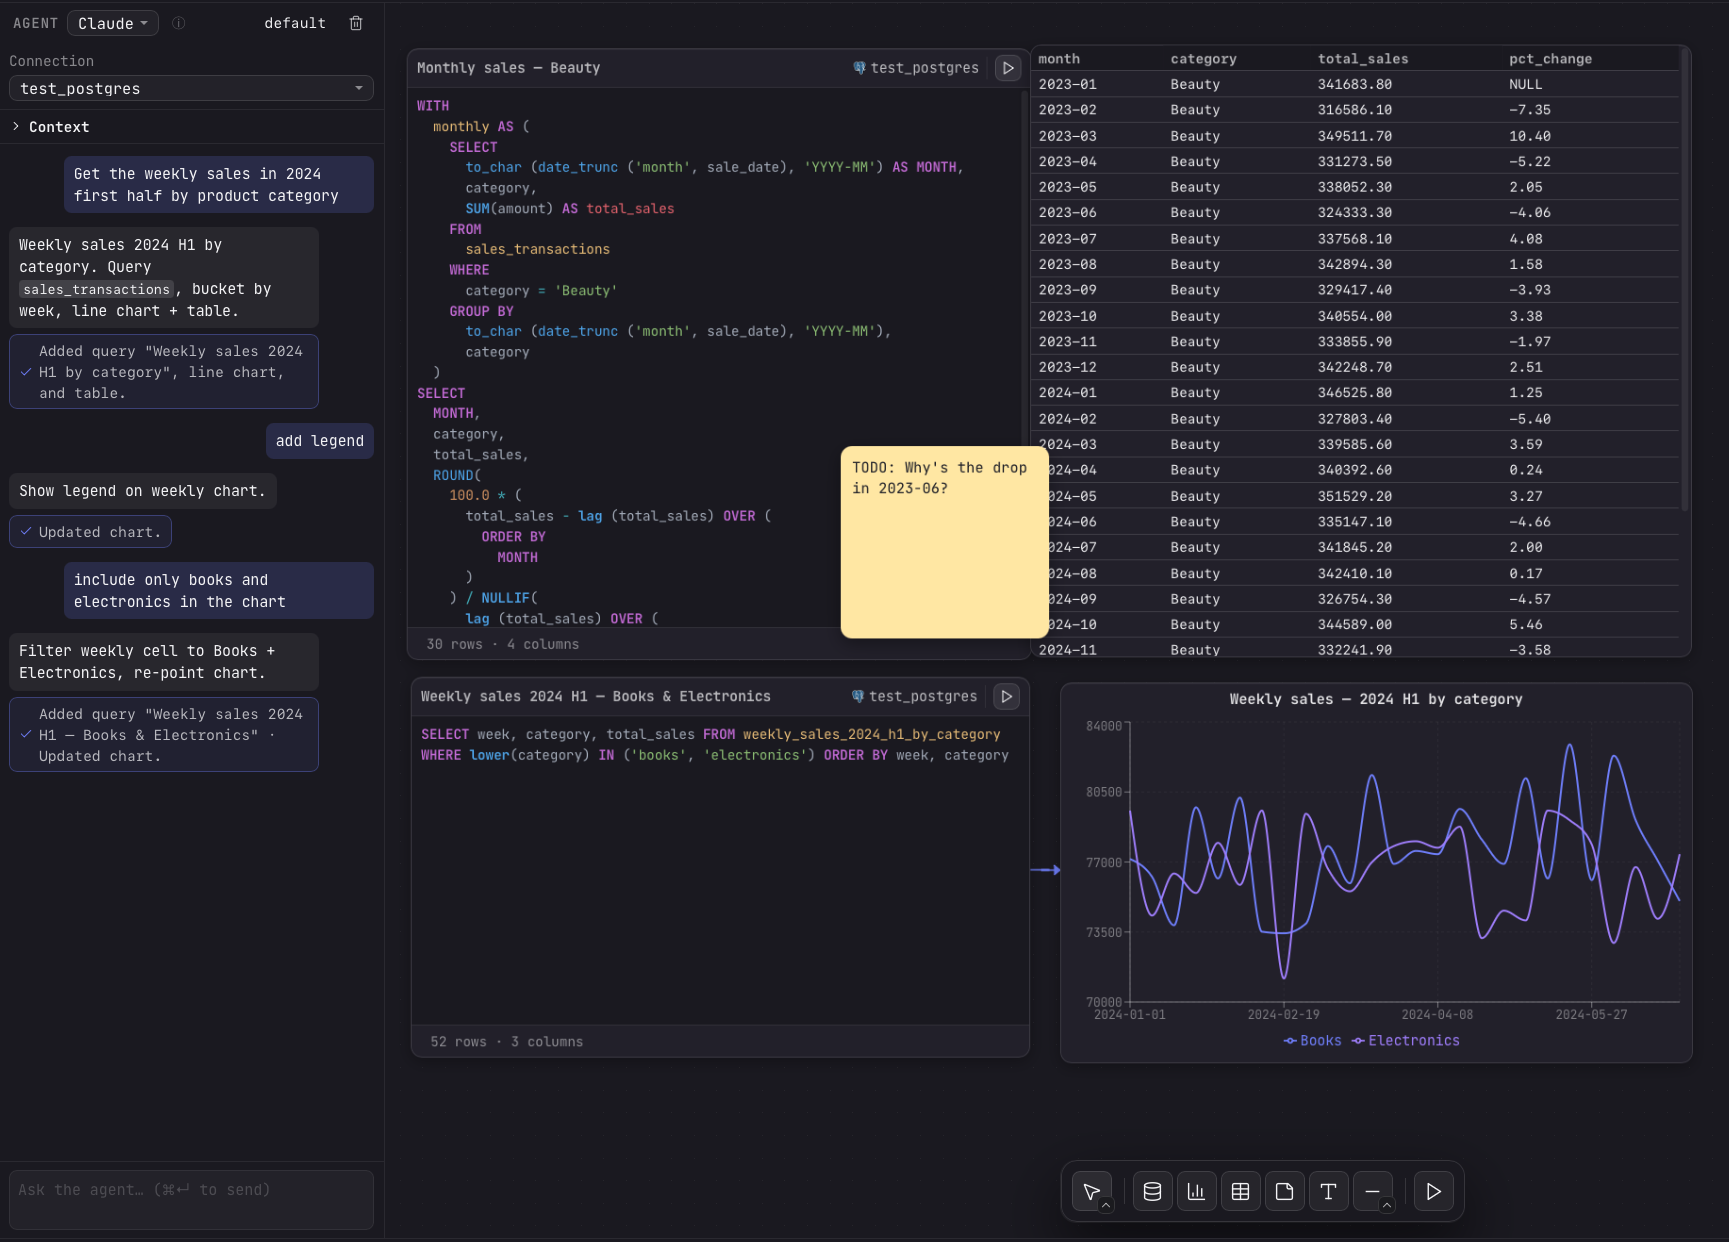
Build with the agent
The agent pane runs down the left of the board. Describe what you want, for example "monthly sales by category", and the agent reads your schema and replies with objects to add: usually a query that aggregates the data, a chart bound to it, and a one-line summary. Arris places them on the board, runs the query, and renders the chart from the result. A green check chip under each reply summarizes exactly what changed ("Added / Updated / Removed ...").
Sending a turn
- Pick the provider (Codex or Claude) in the chat header.
- You must have a connection selected. Without one the agent cannot write correct SQL, so it replies asking you to connect a database first.
- Type your request and press ⌘↵ to send. Replies stream in as markdown; a Stop control appears while the agent is working.
- Each turn also sees the current board, so follow-ups refine it in place rather than only adding to it. Ask the agent to switch a chart to a line, set axis bounds, rewrite a query, retitle a cell, move a query to another connection, or remove objects you no longer want. It can add, modify, or remove any object kind. Any query it adds or changes runs automatically, and the charts and tables bound to that query update.
What the agent sees
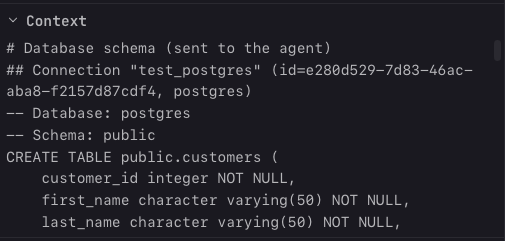
While schemas load, the pane shows a Fetching schema & table info spinner. Expand the collapsible Context section to read the exact text handed to the agent: the schema (one labeled block per connection, headed with the connection's name and dialect) followed by a one-line-per-object summary of the board.
The agent runs the provider's CLI locally in read-only mode, with no database access and no file or shell tools. By default it receives only your prompt, each connection's schema (as DDL and dialect), and a short summary of the objects already on the board (their kinds, ids, titles, and SQL). Your query results stay on your machine and never leave it unless you explicitly share them: when a request needs the actual rows (for example, a written analysis of the data), the agent asks for permission to access those results first, and you can deny. The schema is size-capped, and a slow database is skipped after 15 seconds so a turn is never blocked.
Building on existing results
When the answer can come from a query already on the board, the agent does not re-query the
database. It writes a new query that selects FROM an existing cell (referenced by that
cell's title), which runs in an in-memory engine (Apache DataFusion). This is the same cell-chaining
you can write by hand. The agent falls back to a fresh database query only when no cell has the
columns or grain it needs.
Sharing results when the agent asks
Because the agent cannot see row data, it asks when it needs it. Instead of changing the board, it posts a Share results with the agent? card listing the cells it wants (each with its row and column count) and why. You choose:
- Share results sends those rows in the next turn so the agent can write commentary or follow-ups grounded in real data. The button is disabled until at least one listed cell has actually been run.
- Decline tells the agent to continue without them.
Nothing leaves your machine until you click Share results. After you answer, the card is marked as answered and takes no further input.
The conversation
The chat log is saved with the board, so closing and reopening a canvas (or restarting Arris) brings back the full history and the agent picks up where it left off. The Clear conversation button (the trash icon in the header) stops any in-flight turn, drops the agent session so the next message starts fresh, and wipes the saved history.
Build it by hand
Every object can also be added directly, without the agent. The toolbar at the bottom of the board has a button for each kind; selecting one places a new object in the center of your current view, so it stays in sight however far you have panned.

| Tool | What it does | Shortcut |
|---|---|---|
| Pointer | The caret opens two modes: Move (drag and select objects, the default) and the Hand tool (drag anywhere to pan the board without moving objects). | V / H |
| Query cell | Adds a SQL cell bound to the board's primary connection. | / |
| Chart | Adds a chart. Pick its source query in the properties pane. | None |
| Table | Adds a preview table. Pick its source query in the properties pane. | None |
| Sticky note | Adds a coloured annotation note. | None |
| Text | Adds a free text block for headings and commentary. | None |
| Shape | The caret chooses Rectangle, Ellipse, or Line. | R / O / L |
| Run all | Runs every query on the board, resolving each query's upstream cells first. | None |
The pointer and shape tools remember your last choice: clicking the main button re-applies it and opens the menu, so picking a different option is one more click. The single-key shortcuts fire only while the board is focused, never while you are typing in a query cell or a text block, and every one is rebindable under Settings › Keymap.
Object kinds
Every object can be positioned, sized, locked, and overlapped freely. What each one does:
| Object | What it does |
|---|---|
| Query cell |
A SQL statement in the same dialect-aware, schema-completing editor as the main SQL editor,
with a Run button in its header and a one-line status below ("Running...",
"N rows · N columns", an error, or "Run the query to preview data").
The cell shows no grid itself: on its first successful run a preview table is
auto-placed beside it and joined with an arrow, unless a table or chart is already bound to it.
Reference another cell by title with FROM <cell title> to build on its
result.
|
| Table | Previews a query's rows as a scrollable grid, refreshed whenever that query runs. Shows up to 200 rows by default (configurable). Null values render as NULL. |
| Chart | Visualizes a query's result with the same chart editor as the results viewer (type, axes, series, aggregation, colours, legend, labels), refreshed whenever that query runs. |
| Text | A free text block for headings and commentary. Single-click selects and drags; double-click to edit. Font size, weight, alignment, and colour are set in the properties pane. |
| Sticky note | Free text on a coloured card pinned on top of the board. Double-click to edit; pick one of five tints (yellow, green, blue, pink, purple). |
| Shape | A rectangle, ellipse, or line for grouping and annotation. Rectangles and ellipses hold an optional centered label (double-click to add it); a rectangle's corners round by dragging the radius handle on its top edge; a line can be solid, dashed, or dotted. |
The properties pane
Select a single object and a properties pane opens on the right. Every kind shows X, Y, W, and H inputs and a Locked toggle; editing them moves or resizes the object live. Below that, each kind has its own controls:
- Query: title and connection. (The SQL is edited in the cell body.)
- Table: source query and a preview-row cap (blank uses the default of 200).
- Chart: source query, then the full chart editor: type, axes, appearance, legend, and colours, driven from the bound query's last run.
- Shape: fill colour (rectangles and ellipses), stroke colour and width, line style (solid, dashed, dotted), and corner radius (rectangles).
- Text: font size, bold, alignment (left, center, right), and colour.
- Sticky note: the tint.
Working on the board
- Select and move. Single-click an object to select it; drag to move it (in Move mode). Selection drives the resize handles and the properties pane and persists until you click an empty part of the board.
- Resize. Drag any border or corner handle of a selected object. Handles only appear while it is selected.
- Overlap and reorder. Objects may overlap. Right-click for Bring to front (]), Bring forward, Send backward, and Send to back ([).
- Copy, paste, lock, delete. ⌘C copies the selected object to an in-app clipboard and ⌘V pastes a clone nearby; Lock freezes an object (still selectable, but not movable or resizable until unlocked); Delete or Backspace removes it. All are also in the right-click menu.
- Pan and zoom. Pan with the Hand tool or by dragging an empty part of the board; zoom with the scroll wheel or the controls in the corner (0.2x to 2x). Scrolling inside a table, chart, or query cell scrolls that object, not the board.
- Dependency arrows are automatic. Arrows are drawn when a chart or table binds to its source query, and when one query reads another with
FROM <cell title>. They anchor to both objects' borders and re-route as you move them. You cannot draw them by hand, but you can delete one from its right-click menu. - Run. Run a single query with its Run button (or the editor's run shortcut). Run all on the toolbar runs every query, resolving upstream cells first.
- Fit on open. Reopening a board frames its existing content, so you land on your work rather than empty space.
Saving
A board is saved with your workspace shortly after each change, and survives closing the tab or restarting the app. It stores the objects (their geometry, z-order, lock state, and per-kind settings), the dependency arrows, the pan and zoom, the connection set, and the agent conversation. Query results are not saved. After reopening, query cells show their "Run the query..." state, and tables and charts stay blank until you re-run their source query (or use Run all).
Closed boards live in the Canvas section of the left sidebar, newest first. Click a row to reopen it, double-click to rename, or right-click to rename, move to a project, or delete (a delete can be restored).